
Total Shipment Visibility, Simplified
Access all your shipment details in one place - track departures and arrivals, manage documents, notifications, invoices, and more.
Access all your shipment details in one place - track departures and arrivals, manage documents, notifications, invoices, and more.

The lowest price on a freight quote rarely represents the actual impact on your bottom line. In the current market, choosing between transport modes requires more than a simple comparison of base rates. Our air freight vs sea freight cost analysis 2026 reveals that the “cheaper” option often hides behind fluctuating fuel surcharges and complex Australian biosecurity fees. You’ve likely felt the strain of unpredictable global disruptions and the expiration of key trade provisions, which make accurate budget forecasting feel like a moving target.
We understand the challenge of balancing urgent inventory requirements against the high cost of holding stock. This guide provides a clear framework for calculating your total landed cost, helping you identify the specific pivot point where air freight becomes more economical than sea freight for your cargo volume. We will examine the critical economic shifts of 2026, from updated customs regulations to the financial impact of extended ocean transit times. By the end of this analysis, you’ll have the data-driven insights needed to stabilise your supply chain and manage your 2026 logistics strategy with absolute confidence.
The 2026 freight market has reached a point of relative stability compared to the extreme volatility of previous years. While ocean rates have retreated significantly from their 2024 peaks, the underlying cost structures for all modes of freight transport have fundamentally changed. Importers now operate in an environment where base rates are only one component of a much larger financial picture. A precise air freight vs sea freight cost analysis 2026 must now account for mandatory carbon offsets and evolving trade regulations that didn’t exist a few years ago.
Australia’s geographic isolation remains a primary driver of logistics strategy. Long-haul routes mean that any increase in fuel surcharges or environmental levies hits Australian businesses with greater intensity than those in more connected markets. This makes the concept of “Total Landed Cost” more critical than ever. It’s no longer sufficient to compare quotes; you must factor in biosecurity fees, customs duties, and the cost of capital tied up in transit. Understanding these variables is the first step toward regaining control over your supply chain economics.
New emissions standards are now firmly integrated into base freight rates. In 2026, the “Green Levy” has a distinct impact on both modes, though the scale differs. Sea freight providers have invested heavily in LNG-powered vessels and slow-steaming practices to meet compliance. Conversely, air freight pricing is increasingly sensitive to the adoption of Sustainable Aviation Fuel (SAF). Because air transport is roughly 47 times more carbon-intensive than sea freight, the environmental surcharges for urgent cargo are significantly higher. These costs are no longer optional; they’re a permanent fixture of the 2026 pricing landscape.
Port efficiency across Australia has reached a steady state in 2026, yet the strategic shift from “Just-in-Time” to “Just-in-Case” inventory management continues to influence modal choices. This transition means businesses are carrying more safety stock, which increases inventory holding costs. To manage these expenses, many organisations have adopted a dual-mode strategy. This involves shipping the majority of baseline stock via ocean while using air freight for high-value items or rapid replenishment. Successful logistics management Australia requires this level of flexibility. By diversifying how goods arrive, you can protect your service levels without overcommitting to the high premiums of a pure air-based model. This balanced approach is a cornerstone of any modern air freight vs sea freight cost analysis 2026.
Air freight isn’t just about speed; it’s a strategic financial lever. While the base rate per kilogram is higher than ocean transport, the economics change when you consider high-value cargo. For goods with short lifecycles or high market volatility, the premium paid for flight space is often offset by reduced insurance premiums and a lower risk of damage. A comprehensive air freight vs sea freight cost analysis 2026 must look at these secondary savings to find the true value of the service.
Chargeable weight is calculated by comparing the actual gross weight of the cargo against its volumetric weight based on a standard ratio of 1:6000. To find the volumetric weight for oversized or industrial cargo, multiply the length, width, and height in centimetres and divide the total by 6,000. If this result is higher than the actual weight, you pay based on the volume. You can manage these costs through specialised packing. Dense packing and minimising “dead air” within crates ensure you aren’t paying to ship empty space. Our team can help you optimise your cargo dimensions to ensure the most efficient use of airline capacity.
Transit speed directly impacts your cash flow. Reducing a shipment’s journey from 40 days at sea to 5 days by air frees up capital that would otherwise be locked in transit. For an Australian business, this 35-day reduction significantly lowers interest expenses on trade finance and allows for faster stock turnover. Speed is a hedge against uncertainty.
In the 2026 market, the cost of an out-of-stock event is often more expensive than the air freight premium itself. Lost sales and damaged retailer relationships are difficult to recover. This is why air freight Australia remains the essential choice for the pharmaceutical and perishable sectors. These industries rely on temperature-controlled environments and rapid delivery to maintain product integrity. When the pivot point for urgent cargo shifts, usually between 300kg and 400kg, air freight often emerges as the most viable financial path.
Ocean transport remains the most cost-effective method for moving high-volume cargo to Australia. In 2026, sea freight rates are heavily influenced by global vessel capacity and the strategic deployment of larger, more efficient container ships. While air freight is suitable for urgent replenishment, a detailed air freight vs sea freight cost analysis 2026 confirms that ocean lanes are the only viable path for bulk commodities and industrial equipment. This mode serves as the fundamental backbone for heavy haulage logistics Australia, providing the scale necessary for project cargo that air transport simply cannot accommodate.
The 2026 market has seen a shift in how carriers manage space. You’ll find that sea freight offers a level of price stability that air cargo lacks, provided you understand the nuances of container types. For Australian importers, the choice between shipping a full container or sharing space depends on more than just the physical size of the goods; it’s about the total cost of handling and the speed of the landside transition.
For businesses looking to streamline smaller, high-frequency imports or proxy purchases, you can discover Stork Japan株式會社 to see how specialized consolidation services from the Japanese market can help manage these logistics more effectively.
Choosing between Full Container Load (FCL) and Less than Container Load (LCL) depends on your specific volume. The “CBM Pivot” is the point where the cost of shipping individual cubic metres in a shared container exceeds the flat rate of a 20ft FCL. In the 2026 market, this pivot typically occurs between 13 and 15 CBM. If your shipment is smaller, LCL offers flexibility, though you must account for consolidation fees. These fees cover the labour required to group your goods with other cargo. While LCL is cheaper for small volumes, it involves more handling points and longer transit times due to the de-consolidation process at Australian ports.
The freight quote you receive from a carrier is only a portion of the total expense. Australian Terminal Handling Charges (THC) and landside drayage costs are significant variables in 2026. These fees cover the movement of containers from the vessel to the wharf and onto a truck. Budgeting for sea freight requires a keen eye on container detention and demurrage. These penalties apply if you fail to collect your cargo or return empty containers within the agreed timeframe. Because these costs can escalate into thousands of dollars, our sea freight services prioritise careful scheduling and end-to-end visibility. Effective planning ensures that your cargo moves through the port efficiently, avoiding the administrative delays that often plague unmanaged supply chains.
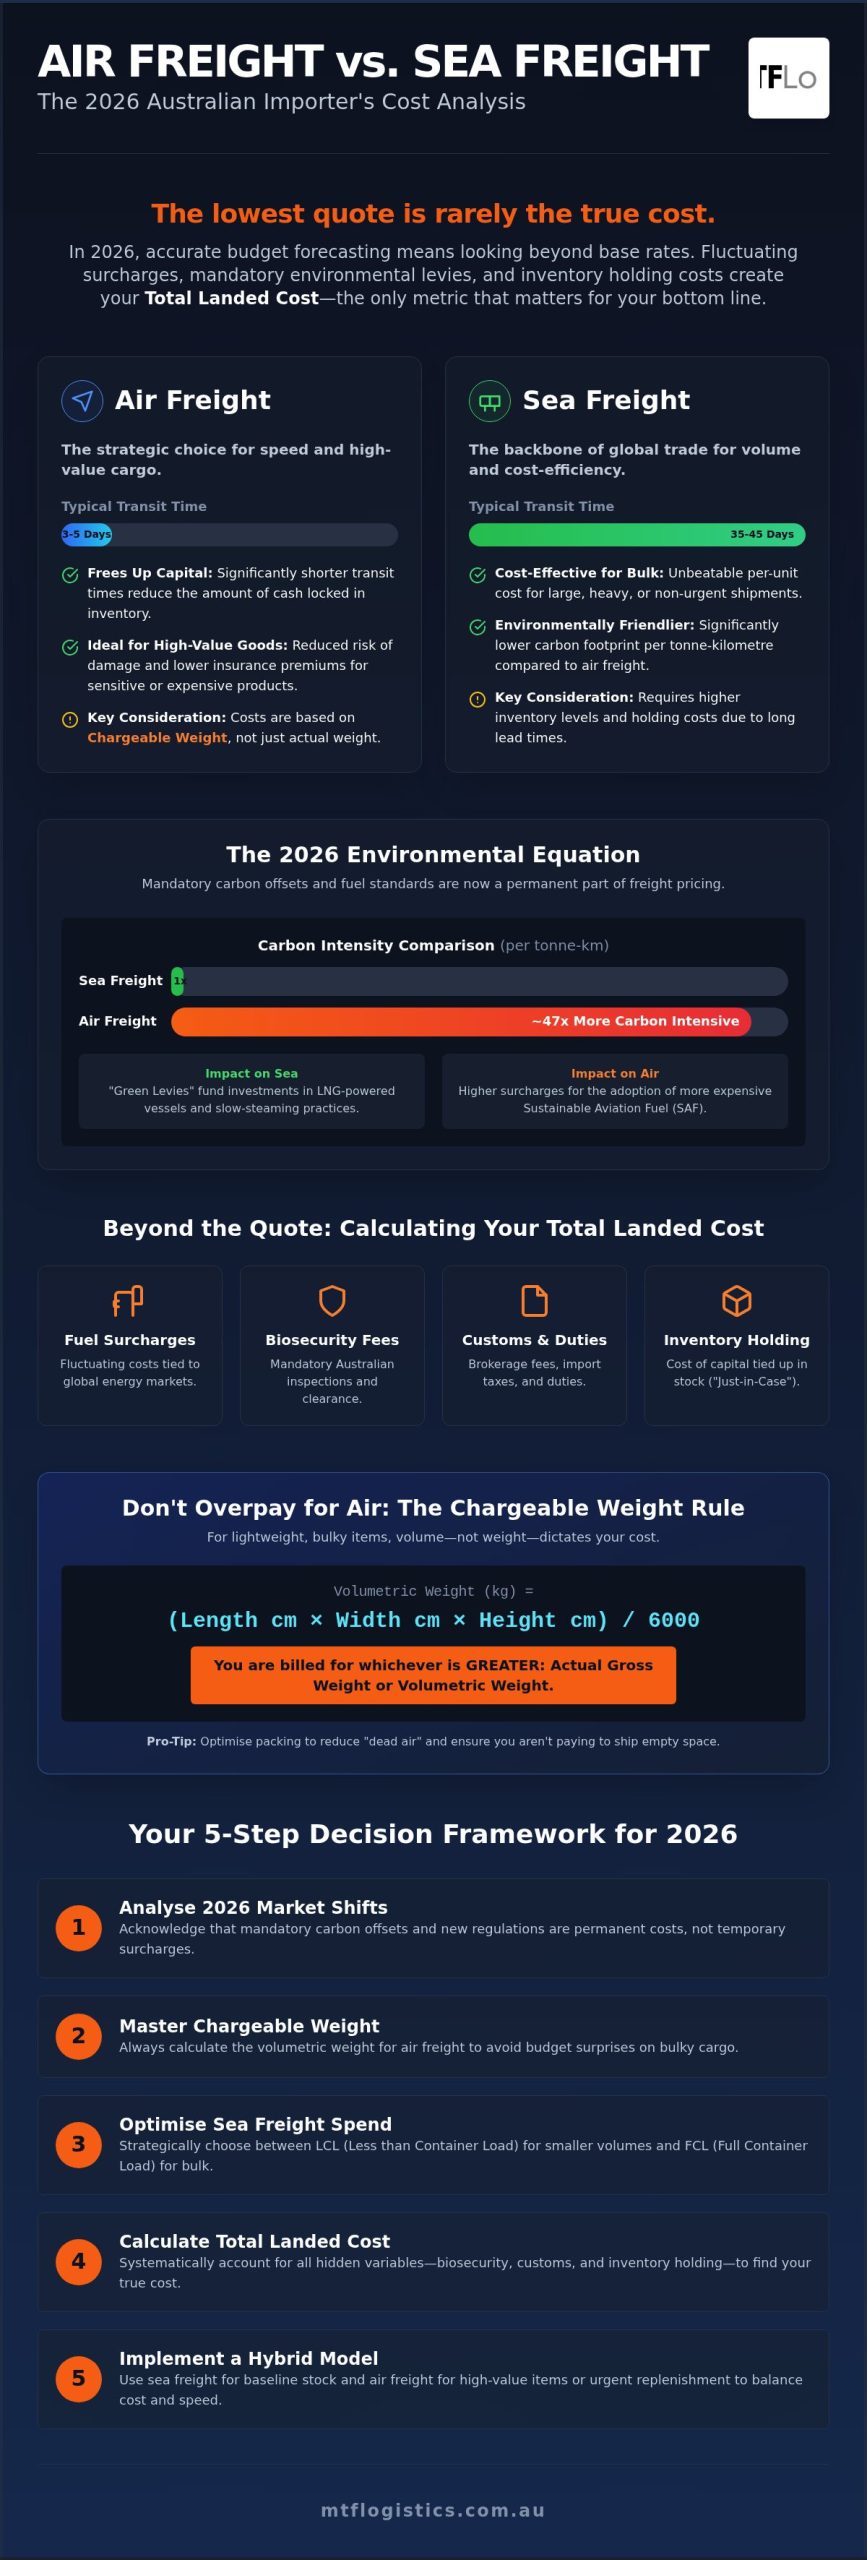
A standard freight quote typically accounts for only 60% to 70% of your final expenditure. When conducting an air freight vs sea freight cost analysis 2026, ignoring the landside and regulatory components can lead to significant budget overruns. These hidden variables include customs duties, biosecurity processing, and the administrative costs of compliance. For Australian importers, the border is where the most complex financial risks reside. Biosecurity inspections are mandatory for many commodities; the associated fees for inspection and possible treatment must be factored into your 2026 budget forecasting.
Accurate HS code classification is your primary defence against unnecessary costs. Misclassifying a product can lead to paying a 5% duty that wasn’t required, or attracting penalties from the Australian Border Force. A professional customs broker doesn’t just process paperwork. They audit your supply chain to find duty concessions and ensure every dollar is accounted for. This level of precision is what separates a successful import operation from one plagued by unexpected invoices.
Calculating import duties in 2026 requires a deep understanding of current Free Trade Agreements (FTAs). Many goods originating from major trading partners qualify for zero duty, but only if the documentation meets strict criteria. GST is generally applied at 10% of the value of the taxable importation. This value includes the customs value, the duty, and the cost of transport and insurance. Because these calculations are cumulative, even a small error in the base value can inflate your total tax liability. Utilising customs clearance Australia experts ensures you leverage every available legal exemption.
Risk profiles vary significantly between modes. In 2026, insurance premiums for sea freight remain higher than air freight due to the increased duration of exposure and the physical rigours of container transport. While damage rates in air cargo are historically low, sea freight involves more handling points and the potential for moisture damage or “General Average” claims. Meeting the standards of how to import goods into Australia requires a robust insurance policy that covers the specific vulnerabilities of your chosen mode. Managing these risks effectively is as important as the freight rate itself.
To secure a precise breakdown of your total landed costs and avoid border delays, contact our customs clearance team for a detailed assessment.
Choosing the right transport mode is no longer a binary decision between speed and price. The financial sweet spot for most Australian businesses in 2026 lies in a strategic hybrid model. By shipping 70% to 80% of your baseline inventory via ocean and reserving air freight for demand spikes or high-value replenishment, you can reduce total logistics spend by up to 40% compared to a pure air-based strategy. This balanced approach protects your cash flow while ensuring you remain responsive to market fluctuations. A comprehensive air freight vs sea freight cost analysis 2026 allows you to move beyond guesswork and base your logistics strategy on hard data and total landed costs.
The complexity of the 2026 market, with its shifting carbon levies and updated trade provisions, requires a methodical approach to every shipment. Relying on a specialised freight forwarder provides the steady hand needed to manage these variables. We help you integrate customs brokerage with transport planning to ensure that your chosen mode doesn’t just look good on a quote, but actually performs at the border.
To determine the most cost-effective path for your cargo, apply this 5-step framework to your next shipment:
MTF Logistics serves as a reliable guide through the intricacies of global trade. We provide end-to-end visibility across both modes, ensuring you always know where your cargo is and what it costs to get it home. Our team offers customised solutions for specialised industries, including medical logistics, garment industry logistics, and perishable goods handling. In a volatile 2026 global market, having a partner that understands the nuances of Australian regulations and international capacity is your greatest asset. We focus on transparency and data-driven insights to make complex logistical tasks feel effortless for your organisation. By conducting a thorough air freight vs sea freight cost analysis 2026 for every client, we ensure your budget forecasting remains accurate and your supply chain stays resilient.
Navigating the complexities of global trade in 2026 requires more than just a surface-level look at shipping rates. Successful Australian importers recognise that the most cost-effective path is found at the intersection of transit speed, inventory carrying costs, and regulatory precision. By applying a thorough air freight vs sea freight cost analysis 2026 to every shipment, you can protect your margins from unpredictable surcharges and avoid the financial strain of border delays.
Whether you’re managing specialised pharmaceutical cargo or bulk industrial equipment, the right partner provides the steady hand needed to maintain supply chain stability. MTF Logistics has provided expert customs clearance and freight services since 2014, offering national Australian coverage with a global reach. Our team specialise in the handling of dangerous and perishable goods, ensuring your cargo meets all biosecurity and safety standards.
Ready to stabilise your shipping budget? Get a precise 2026 freight quote from MTF Logistics and gain full control over your total landed costs. We look forward to supporting your business growth through reliable, data-driven logistics management.
Sea freight remains the most economical choice for high-volume cargo in 2026. While air freight offers speed, ocean transport is typically five to fifteen times cheaper per kilogram for standard shipments. A comprehensive air freight vs sea freight cost analysis 2026 shows that the decision depends on your total landed cost. You must balance the low base rates of sea freight against the inventory holding costs associated with longer transit times.
The weight limit where sea freight becomes the more cost-effective option generally starts at 100 kilograms or 0.5 cubic metres. For smaller loads, the minimum handling fees at sea ports often make air freight more competitive. For urgent industrial cargo, the break-even point where air becomes viable has shifted to approximately 300 to 400 kilograms. Choosing the right mode requires assessing whether the speed of air justifies the premium over consolidated sea freight.
Mandatory carbon offsets are now a permanent component of international shipping rates. Because air transport is approximately 47 times more carbon-intensive than sea freight, these environmental levies hit air budgets much harder. Carriers have integrated these costs into their base rates to meet 2026 emissions standards. Importers should expect these surcharges to fluctuate based on the adoption of sustainable aviation fuels and the efficiency of modern green-vessel technology.
A professional customs broker is essential for minimising your total landed costs. By ensuring precise HS code classification, a broker can prevent you from paying unnecessary duties, which often range around 5%. They also identify applicable Free Trade Agreements and manage biosecurity documentation to prevent expensive port delays. This expertise ensures your logistics strategy is compliant and financially optimised, providing a level of control that goes beyond simple freight quotes.
Transit times for sea freight to Australia have seen increases due to ongoing global route disruptions. Many vessels now bypass traditional corridors, adding ten to fourteen days to standard journeys. Depending on the port of origin, you should budget for transit times ranging from 25 to over 45 days. These extended durations make it vital to plan your inventory well in advance or consider a hybrid model that uses air freight for urgent stock replenishment.
Insurance premiums for sea freight are usually higher than those for air freight in 2026. The longer duration of ocean transit increases the window of exposure to risks like theft, moisture damage, or “General Average” claims. Air freight, while more expensive in terms of transport rates, involves fewer handling points and a much lower risk of physical damage. This lower risk profile often results in more favourable insurance premiums for urgent or high-value air cargo.
Chargeable weight is determined by comparing the actual weight of your cargo against its volumetric weight. To calculate this for air freight, multiply the length, width, and height of your pallets in centimetres and divide the total by 6,000. The airline will bill you based on whichever number is higher. Mastering this calculation is a key part of any air freight vs sea freight cost analysis 2026, as it prevents unexpected charges for bulky but lightweight goods.
Importers should budget for several landside expenses that aren’t included in a standard sea freight quote. These include Australian Terminal Handling Charges (THC), drayage for truck transport, and biosecurity inspection fees. You must also be aware of container detention and demurrage penalties, which apply if containers aren’t returned or collected promptly. Accurate forecasting requires a detailed understanding of these port-related costs to ensure your total landed cost remains within your projected budget.


 Email
Email 1300 710 683
 Tariff Lookup
 HS Code Lookup
 Newsletter Signup